Fig. 19
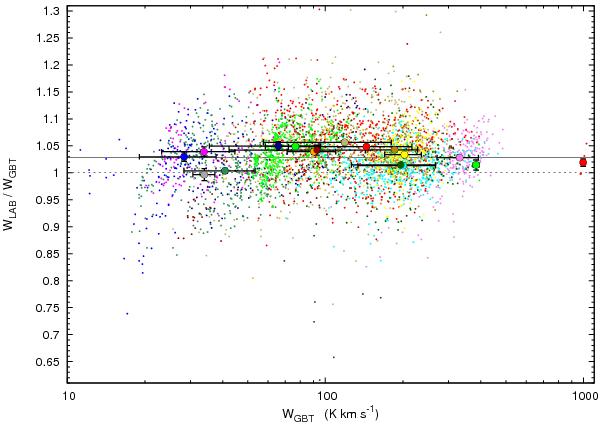
WLAB/WGBT for every spectrum that could be compared (dots, color-coded by region). Filled circles show, for each of the observed regions, the weighted average ratio and its uncertainty (smaller than the filled circle for the typical uncertainty of ~0.004 in the regional averages), along with the region’s average WGBT and its dispersion (indicated by the horizontal errorbars). These comparisons suggest that a single scale factor (horizontal solid line, from Eq. (9)) might be too simplistic.
Current usage metrics show cumulative count of Article Views (full-text article views including HTML views, PDF and ePub downloads, according to the available data) and Abstracts Views on Vision4Press platform.
Data correspond to usage on the plateform after 2015. The current usage metrics is available 48-96 hours after online publication and is updated daily on week days.
Initial download of the metrics may take a while.