Fig. 18
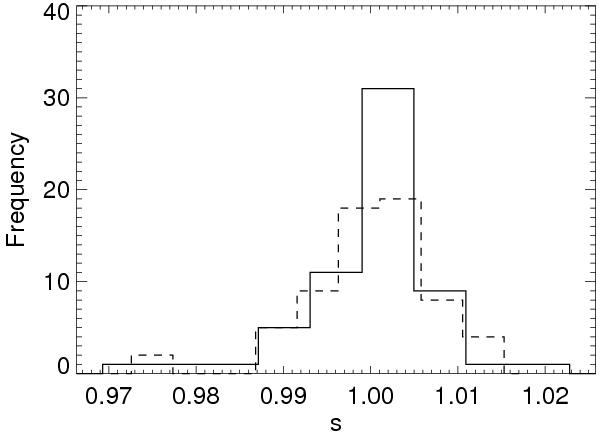
The distribution of slopes s from regressions of T on ⟨T⟩ for S6 (dashed) and S8 (solid) from observations made over 2.5 years. The dispersions of 0.007 and 0.008, respectively, result from line noise, baseline errors, and errors in the stray radiation correction, and potentially from gain variations.
Current usage metrics show cumulative count of Article Views (full-text article views including HTML views, PDF and ePub downloads, according to the available data) and Abstracts Views on Vision4Press platform.
Data correspond to usage on the plateform after 2015. The current usage metrics is available 48-96 hours after online publication and is updated daily on week days.
Initial download of the metrics may take a while.