Fig. 17
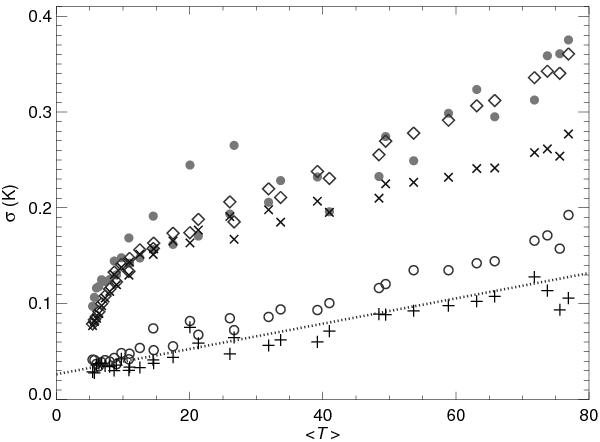
Estimating the noise in the spectrum T of S8, using repeated observations. Plus symbols show the observed standard deviation of ΔT12 from channel by channel comparisons of two consecutive spectra, which ought to have very similar stray radiation and baselines. The measurements agree closely with the prediction (dotted line) from Eq. (6) for line noise alone. Open circles give the standard deviation of ΔTpol; these lie slightly above the prediction because of baseline errors. The filled circles give the standard deviation of ΔT = T − ⟨T⟩, which reflects all errors. As a prediction of this, the crosses show the result of adding 7% of the rms spectrum of the stray radiation correction in quadrature to the standard deviation of ΔTpol. The diamonds result from further addition of the effects of tiny 0.3% gain changes. The S8 data are consistent with errors in stray ~7% and scaling (e.g., gain) errors of <0.3%.
Current usage metrics show cumulative count of Article Views (full-text article views including HTML views, PDF and ePub downloads, according to the available data) and Abstracts Views on Vision4Press platform.
Data correspond to usage on the plateform after 2015. The current usage metrics is available 48-96 hours after online publication and is updated daily on week days.
Initial download of the metrics may take a while.