Fig. 16
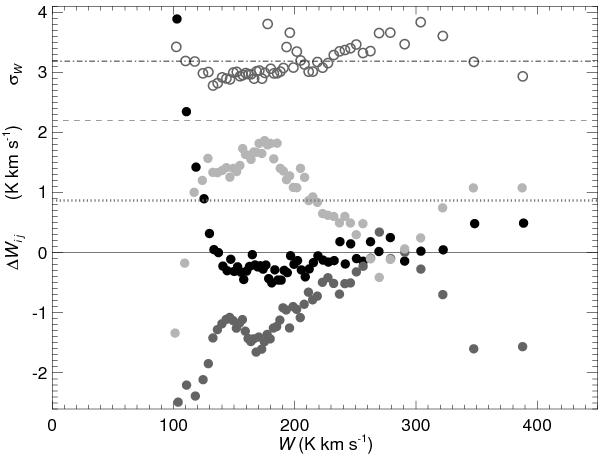
Estimating the noise in the line integral W using ΔWij. Open circles give the standard deviation of ΔWij over all ij combinations within bins of 800 data points as a function of W, using repeated observations of spectra from all NEP pointings as in Fig. 15. This agrees closely with the prediction (dashed-dotted line) based on the accumulation of systematic errors in the stray radiation and baseline corrections added in quadrature with the line noise. The line noise and baseline errors (dotted and dashed lines from Fig. 14) are shown for comparison. Note that the error arising from the stray radiation and baseline correction is dominant in measurements of W, even though it is not dominant for measurements of the spectrum T (Fig. 15). Also shown are the data (filled circles) for the means ΔWij for each ij combination.
Current usage metrics show cumulative count of Article Views (full-text article views including HTML views, PDF and ePub downloads, according to the available data) and Abstracts Views on Vision4Press platform.
Data correspond to usage on the plateform after 2015. The current usage metrics is available 48-96 hours after online publication and is updated daily on week days.
Initial download of the metrics may take a while.