Fig. 15
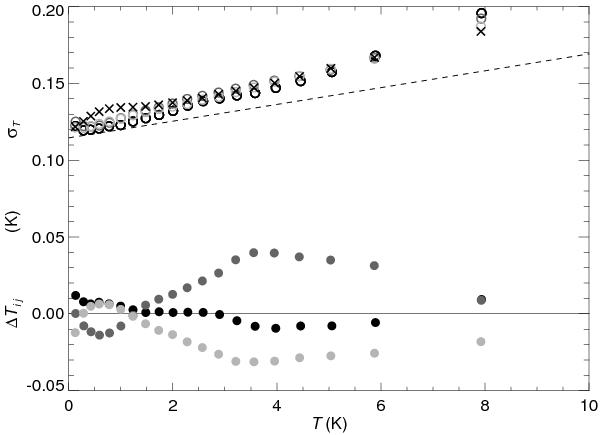
Estimating the error in a spectrum T following stray radiation removal, using repeated observations in the NEP field. Open circles give the standard deviation of ΔTij within bins of 2 × 10⁵ data points as a function of T, using spectra from the three pairs of NEP observations (dark gray: 3−2, light gray: 1−3, black: 2−1). These lie slightly in excess of the prediction based on only line noise plus baseline errors (dashed line). Also shown is the mean of ΔTij for each bin for each ij combination. Both the excess and non-zero means arise from imperfect stray radiation removal. Crosses show a simple estimate of the total error which combines 6% of the rms spectrum of the stray radiation correction in quadrature with the line noise.
Current usage metrics show cumulative count of Article Views (full-text article views including HTML views, PDF and ePub downloads, according to the available data) and Abstracts Views on Vision4Press platform.
Data correspond to usage on the plateform after 2015. The current usage metrics is available 48-96 hours after online publication and is updated daily on week days.
Initial download of the metrics may take a while.