Fig. 13
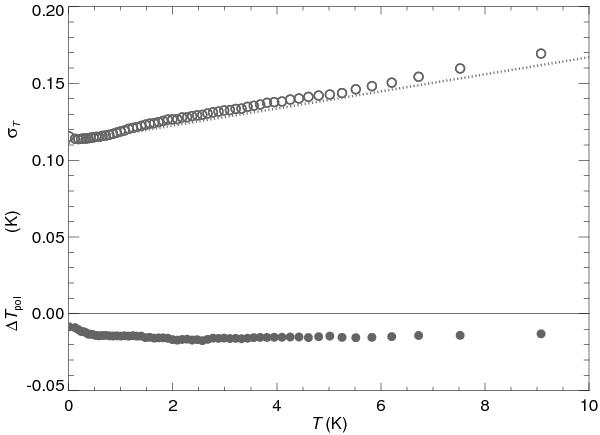
Estimating the noise in a spectrum T using ΔTpol. Open circles give the standard deviation of ΔTpol within bins of 2 × 10⁵ data points as a function of T, using spectra from all NEP pointings. This agrees closely with the prediction (dotted line) from Eq. (6) with σ0 = 0.111 K and Tsys = 20 K. Also shown is the mean of ΔTpol for each bin.
Current usage metrics show cumulative count of Article Views (full-text article views including HTML views, PDF and ePub downloads, according to the available data) and Abstracts Views on Vision4Press platform.
Data correspond to usage on the plateform after 2015. The current usage metrics is available 48-96 hours after online publication and is updated daily on week days.
Initial download of the metrics may take a while.