Fig. 12
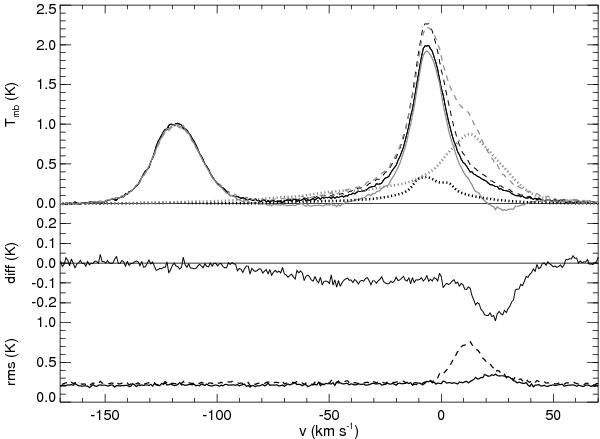
Like Fig. 11, but based on 264 contiguous spectra in a subregion of N1. The stray correction at one LST is slightly too large, pushing the corrected spectrum slightly negative in the high-velocity wing. However, overall the correction is as effective as in the NEP example; note that the middle and lower panels are on the same scales as in Fig. 11.
Current usage metrics show cumulative count of Article Views (full-text article views including HTML views, PDF and ePub downloads, according to the available data) and Abstracts Views on Vision4Press platform.
Data correspond to usage on the plateform after 2015. The current usage metrics is available 48-96 hours after online publication and is updated daily on week days.
Initial download of the metrics may take a while.