Fig. 11
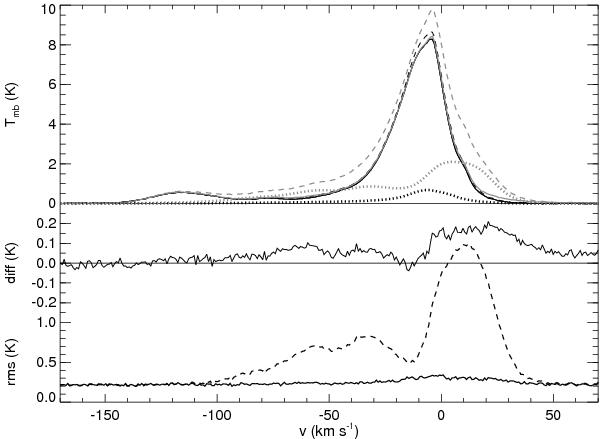
Example of correction for stray radiation for a subregion in the NEP field. Upper panel: dashed curves show spectra taken at different LST (black and gray) with different stray radiation. Each curve is the average of 280 contiguous H i spectra on the Tmb scale; averaging is essential for lowering the noise, to reveal more clearly the effects of stray radiation. Dotted curves: our calculation of the expected stray radiation. Solid curves: spectra corrected for stray radiation, now well aligned. Middle panel: mean difference of the corrected spectra (note that the difference of the uncorrected spectra, or of the stray radiation, would be far offscale). Lower panel: spectra showing the rms of the 280 individual differences before (dashed) and after (solid) the correction for the stray radiation.
Current usage metrics show cumulative count of Article Views (full-text article views including HTML views, PDF and ePub downloads, according to the available data) and Abstracts Views on Vision4Press platform.
Data correspond to usage on the plateform after 2015. The current usage metrics is available 48-96 hours after online publication and is updated daily on week days.
Initial download of the metrics may take a while.