Fig. 10
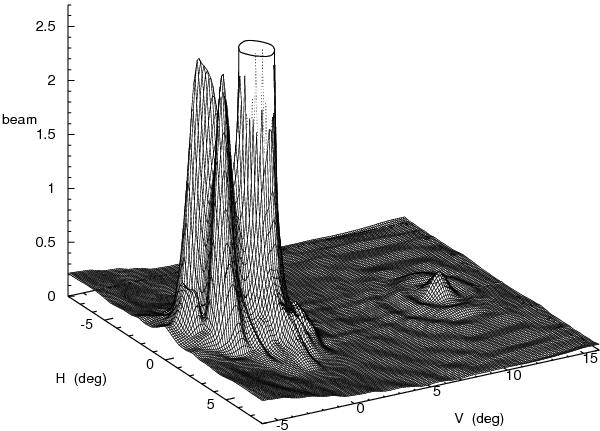
Measured GBT response pattern P, as in Fig. 9, but for sidelobes closer to the main beam. The Arago spot, peaking at ≈ 0.25, is visible at the right, along with its surrounding rings. The double-peak feature at (H,V) ~ (±1°, −3°) appears just to the left of the (truncated) main beam, with height P ≈ 2.6. This contains the power scattered from the forward spillover lobe by the reflecting screen on the feed arm (Fig. 3). The peak of the main beam would be far offscale at P = 1.12 × 10⁵.
Current usage metrics show cumulative count of Article Views (full-text article views including HTML views, PDF and ePub downloads, according to the available data) and Abstracts Views on Vision4Press platform.
Data correspond to usage on the plateform after 2015. The current usage metrics is available 48-96 hours after online publication and is updated daily on week days.
Initial download of the metrics may take a while.