Fig. 6
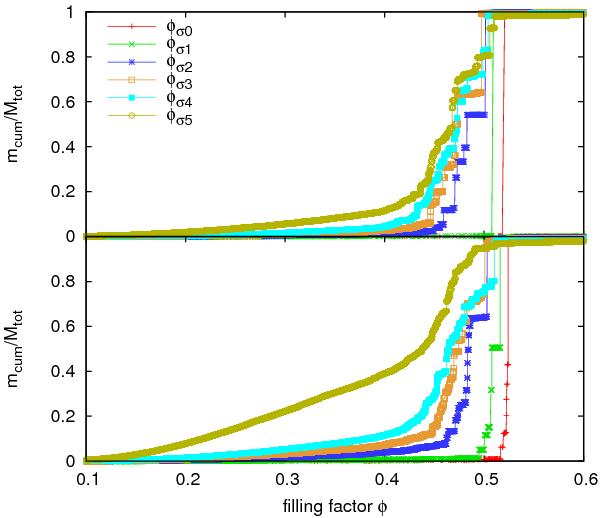
Cumulative mass of the fragment masses over their average filling factor φ. The mass is normalised by the total fragment mass mtot. The collision velocities are v0 = 10 m s-1 (top) and v0 = 12.4 m s-1 (bottom). Compared to the initial distribution of filling factors (Fig. 1), the curves are shifted significantly towards higher filling factors. This reflects the compression taking place during the collision.
Current usage metrics show cumulative count of Article Views (full-text article views including HTML views, PDF and ePub downloads, according to the available data) and Abstracts Views on Vision4Press platform.
Data correspond to usage on the plateform after 2015. The current usage metrics is available 48-96 hours after online publication and is updated daily on week days.
Initial download of the metrics may take a while.