Fig. 2
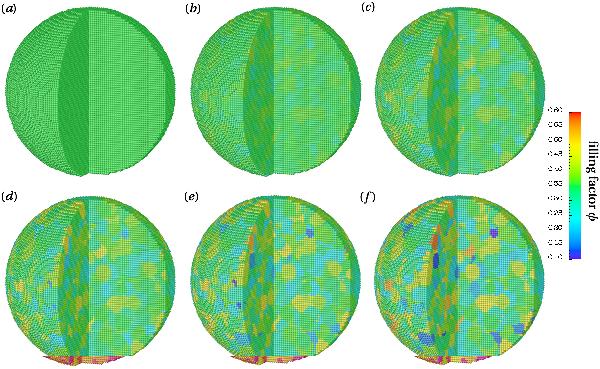
Interior and exterior view of the targets for different inhomogeneities with the filling factor colour coded. The inhomogeneity increases from the homogeneous target a) to the most inhomogeneous target f). In particular, the standard deviations are φσ = 0 a), φσ = 0.01 b), φσ = 0.02 c), φσ = 0.03 d), φσ = 0.04 e), and φσ = 0.05 f). All targets have a similar pattern that originates from considering interacting particle packages in the implementation. With increasing φσ the maximum and minimum filling factor of the different spots increase and decrease, respectively. The projectiles have a similar appearance. The result of collisions among these aggregates with 10 m s-1 are depicted in Fig. 3.
Current usage metrics show cumulative count of Article Views (full-text article views including HTML views, PDF and ePub downloads, according to the available data) and Abstracts Views on Vision4Press platform.
Data correspond to usage on the plateform after 2015. The current usage metrics is available 48-96 hours after online publication and is updated daily on week days.
Initial download of the metrics may take a while.