Fig. 2
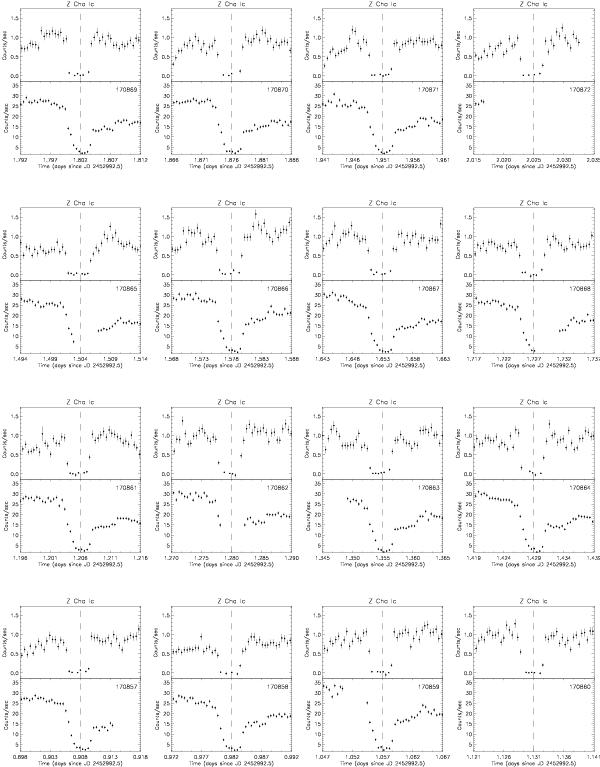
The X-ray eclipses in the 0.2−10 keV (upper part of each panel) band and the corresponding view of the OM instrument (bottom part). The vertical dashed line represents the position of the optical mid eclipse (using the ephemeris of Baptista et al. 2002). The number of the cycle corresponding to the plotted eclipse is also given.
Current usage metrics show cumulative count of Article Views (full-text article views including HTML views, PDF and ePub downloads, according to the available data) and Abstracts Views on Vision4Press platform.
Data correspond to usage on the plateform after 2015. The current usage metrics is available 48-96 hours after online publication and is updated daily on week days.
Initial download of the metrics may take a while.