Fig. 8
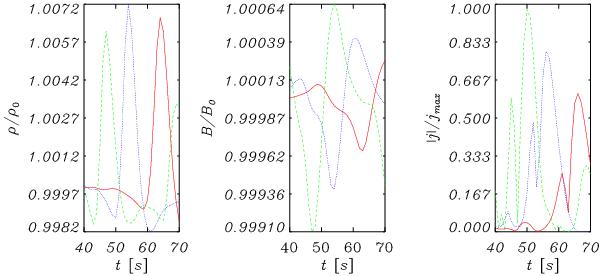
Time profiles of the perturbations of mass density, magnetic induction and current density in a slow magnetoacoustic pulse, measured at x/L = 0.1 and z/L = 0.05 for different values of plasma β. The initial shape of the pulse is Gaussian. The solid (red) curve corresponds to β = 0.3, dotted (blue) β = 0.43 and dashed (green) β = 0.59. The results were obtained for Ta = 0.1T0.
Current usage metrics show cumulative count of Article Views (full-text article views including HTML views, PDF and ePub downloads, according to the available data) and Abstracts Views on Vision4Press platform.
Data correspond to usage on the plateform after 2015. The current usage metrics is available 48-96 hours after online publication and is updated daily on week days.
Initial download of the metrics may take a while.