Fig. 1
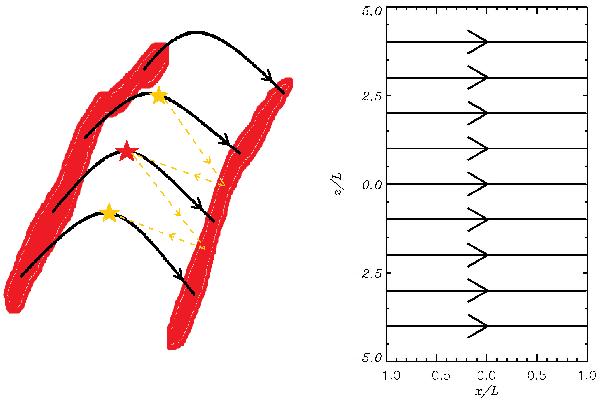
Magnetic arcade of a two-ribbon flare (on the left) and its model (on the right) used during simulations. The black lines illustrate the magnetic field lines. The red regions in the left panel show the flare ribbons while we implemented line-tying boundary conditions at the left and the right boundary of simulation region. The yellow dashed lines show the race of the fastest slow magnetoacoustic waves. The red star shows the position of ignition of slow wave. The yellow stars show the positions of the secondary energy releases induced by the slow magnetoacoustic pulses.
Current usage metrics show cumulative count of Article Views (full-text article views including HTML views, PDF and ePub downloads, according to the available data) and Abstracts Views on Vision4Press platform.
Data correspond to usage on the plateform after 2015. The current usage metrics is available 48-96 hours after online publication and is updated daily on week days.
Initial download of the metrics may take a while.