Fig. 1
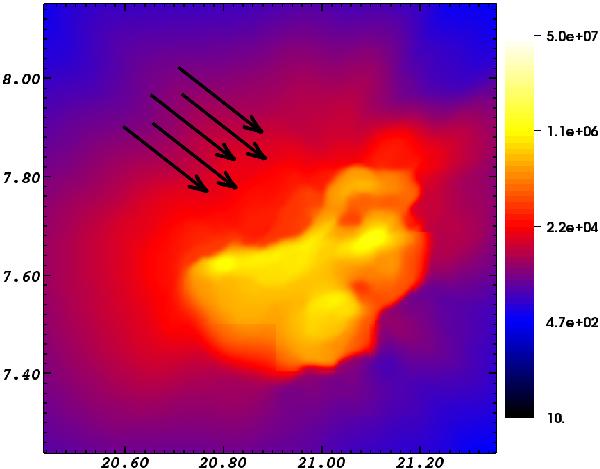
Density morphology of model M 19, i.e., with FX = 160 erg s-1 cm-2, at t = 2/3tff. The image shows a slice through the XY-plane of the center of the cloud. The color represents the number density (cm-3) and the axes are in parsec. The arrows represent the direction of radiation emanating from the black hole, which is located at the upper left side.
Current usage metrics show cumulative count of Article Views (full-text article views including HTML views, PDF and ePub downloads, according to the available data) and Abstracts Views on Vision4Press platform.
Data correspond to usage on the plateform after 2015. The current usage metrics is available 48-96 hours after online publication and is updated daily on week days.
Initial download of the metrics may take a while.