Fig.3
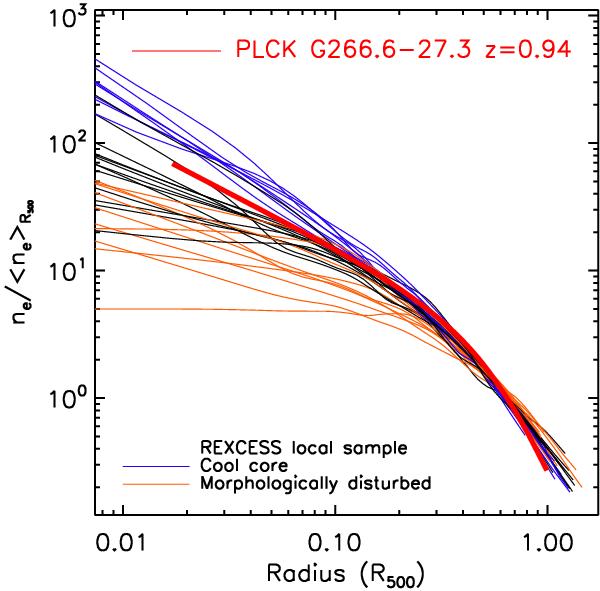
Scaled density profiles of the REXCESS local cluster sample (Böhringer et al. 2007; Croston et al. 2008). The blue lines show the profiles for the cool core systems, and the orange lines the density profiles of the morphologically disturbed systems. The density profile of PLCKG266.6−27.3 is shown with a thick red line.
Current usage metrics show cumulative count of Article Views (full-text article views including HTML views, PDF and ePub downloads, according to the available data) and Abstracts Views on Vision4Press platform.
Data correspond to usage on the plateform after 2015. The current usage metrics is available 48-96 hours after online publication and is updated daily on week days.
Initial download of the metrics may take a while.