Fig.2
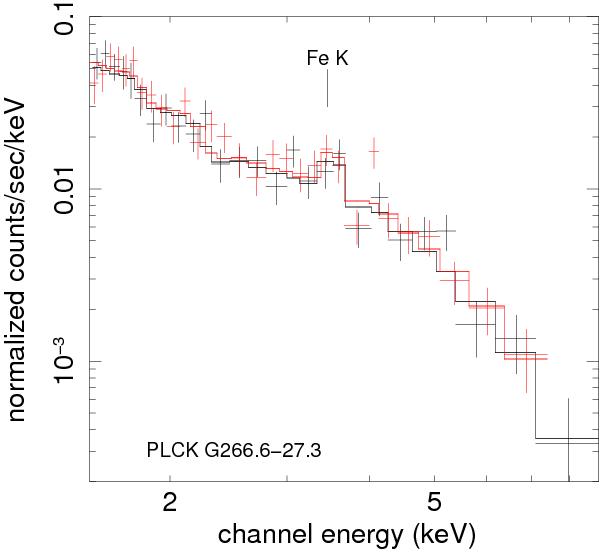
XMM-Newton EMOS1 (black) and EMOS2 (red) spectra extracted from a
circular region of  in radius and centred in the cluster
X-ray peak. Only the data points above 2 keV are shown for clarity, but data down
to 0.3 keV are used in the spectral fitting. The line is the thermal model for the
best-fitting redshift, z = 0.94 ± 0.02. The position of the
redshifted Fe K line is marked.
in radius and centred in the cluster
X-ray peak. Only the data points above 2 keV are shown for clarity, but data down
to 0.3 keV are used in the spectral fitting. The line is the thermal model for the
best-fitting redshift, z = 0.94 ± 0.02. The position of the
redshifted Fe K line is marked.
Current usage metrics show cumulative count of Article Views (full-text article views including HTML views, PDF and ePub downloads, according to the available data) and Abstracts Views on Vision4Press platform.
Data correspond to usage on the plateform after 2015. The current usage metrics is available 48-96 hours after online publication and is updated daily on week days.
Initial download of the metrics may take a while.