Fig.1
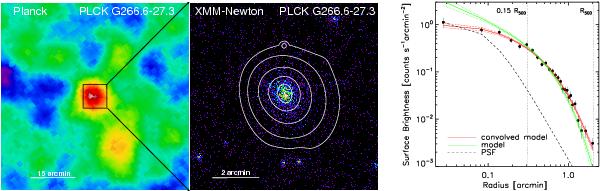
Left panel: PlanckYSZ map of PLCKG266.6−27.3 obtained with the modified internal linear combination algorithm (MILCA; Hurier et al. 2010) with a spatial resolution of 10′. Middle panel: XMM-Newton exposure-corrected count rate image of the region indicated by the black box in the left panel. It is obtained using data from the EMOS12 and EPN camera in the [0.3−2.0] keV energy band. The contours of the XMM-Newton image after wavelet filtering are overlaid in white. Right panel: corresponding XMM-Newton surface brightness profile. The green line indicates the best-fitting β-model with a cusp (see text); the red line is this model convolved with the point spread function (PSF) of XMM-Newton, and the dashed line is the on-axis PSF of XMM-Newton, normalised to the central intensity. The source is clearly significantly extended.
Current usage metrics show cumulative count of Article Views (full-text article views including HTML views, PDF and ePub downloads, according to the available data) and Abstracts Views on Vision4Press platform.
Data correspond to usage on the plateform after 2015. The current usage metrics is available 48-96 hours after online publication and is updated daily on week days.
Initial download of the metrics may take a while.