Fig. 9
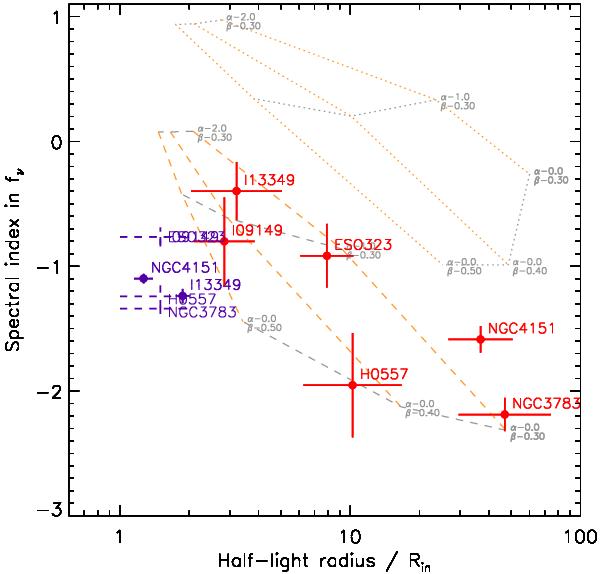
The mid-IR (8.5−13 μm) spectral indices in fν are plotted in red against normalized half-light radii R1/2/Rin at 13 μm. Also plotted in purple are spectral indices between 2.2 and 13 μm against thin-ring radii at 2.2 μm normalized by Rin. For the four objects without near-IR interferometry data, we indicated the near- to mid-IR spectral indices in dashed lines over the thin-ring radius range of 1−2 Rin, roughly expected based on other targets observed with the Keck interferometer (see Fig. 7). The dotted line shows the grid for a simple power-law model with radial surface density index α of (−2.0, −1.0, −0.0) and temperature index β of (−0.5, −0.4, −0.3) with the innermost tempeture Tin = 1400 K. The grid covers the observed range of R1/2/Rin, but systematically bluer in spectral shape. The dashed lines show the same grid but with Tin = 700 K, which apparently matches the mid-IR observations over the sample when the density index ranges from ~− 1 to 0 in different objects with a temperature index of ~− 0.35 ± 0.05 (for details, see Sect. 4.4).
Current usage metrics show cumulative count of Article Views (full-text article views including HTML views, PDF and ePub downloads, according to the available data) and Abstracts Views on Vision4Press platform.
Data correspond to usage on the plateform after 2015. The current usage metrics is available 48-96 hours after online publication and is updated daily on week days.
Initial download of the metrics may take a while.