Fig. 5
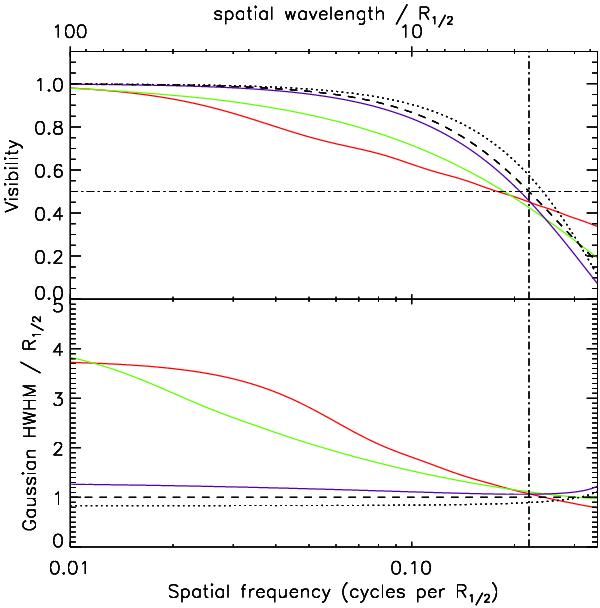
Top: comparison between visibility functions for Gaussian, shown as a dashed curve, and power-law distributions where red, green, and purple curves correspond to the cases of R1/2 = 6, 2, 1.3 Rin, respectively. For comparison, the visibility function of a thin ring with radius being equal to the Gaussian HWHM (i.e. R1/2) is shown as a dotted curve. Bottom: the ratio of Gaussian HWHM to R1/2 is plotted against the same spatial frequency in each case. The vertical dot-dash line corresponds to the spatial wavelength of 4.5 R1/2.
Current usage metrics show cumulative count of Article Views (full-text article views including HTML views, PDF and ePub downloads, according to the available data) and Abstracts Views on Vision4Press platform.
Data correspond to usage on the plateform after 2015. The current usage metrics is available 48-96 hours after online publication and is updated daily on week days.
Initial download of the metrics may take a while.