Fig. 3
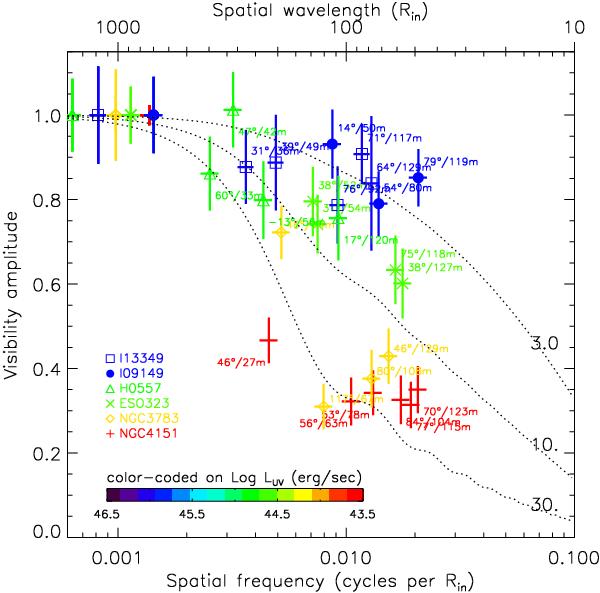
Observed mid-IR visibilities of all the targets, each averaged over 10 to 12 μm in the rest frame of each object, shown as a function of spatial frequency in units of cycles per Rin (log-scale). The data are color-coded in terms of the UV luminosity of the central engine for the corresponding object, which is defined to be 6 νLν(5500 Å) (Kishimoto et al. 2007). Each data point is plotted with different symbols for different objects, and is labeled with the PA / length of the baseline. It is quite clear that the radial structure in units of Rin changes from being compact in higher luminosity objects to extended in lower luminosity objects. Dotted curves are visibility functions for power-law brightness distribution with the normalized half-light radius R1/2/Rin = 3, 10, and 30., which roughly depict the brightness distributions from higher to lower luminosity objects.
Current usage metrics show cumulative count of Article Views (full-text article views including HTML views, PDF and ePub downloads, according to the available data) and Abstracts Views on Vision4Press platform.
Data correspond to usage on the plateform after 2015. The current usage metrics is available 48-96 hours after online publication and is updated daily on week days.
Initial download of the metrics may take a while.