Free Access
Fig. A.3
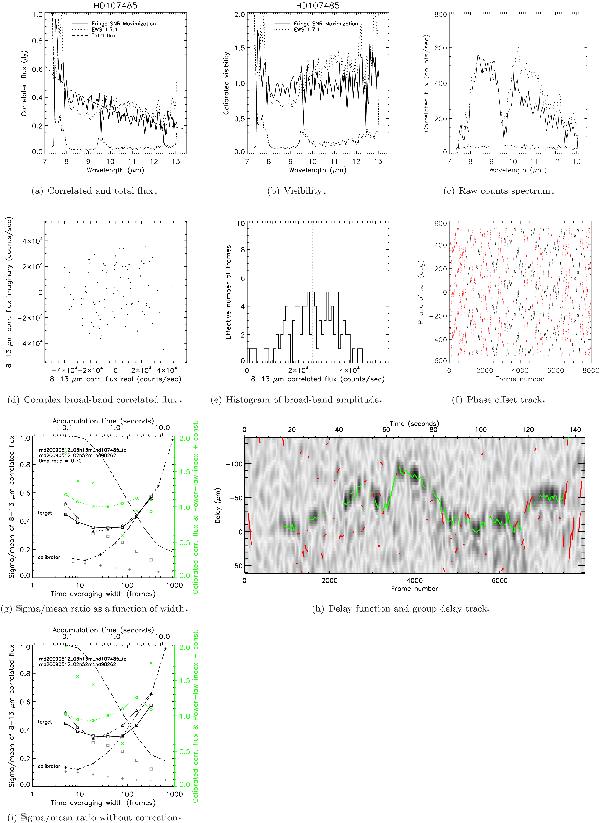
The same as Fig. A.1, but for the data taken on 2009-05-12. The panel g) shows the σ/m curve after the correction for the time scale difference between the target and calibrator, while the panel i) shows the curves before the correction.
Current usage metrics show cumulative count of Article Views (full-text article views including HTML views, PDF and ePub downloads, according to the available data) and Abstracts Views on Vision4Press platform.
Data correspond to usage on the plateform after 2015. The current usage metrics is available 48-96 hours after online publication and is updated daily on week days.
Initial download of the metrics may take a while.