Fig. 12
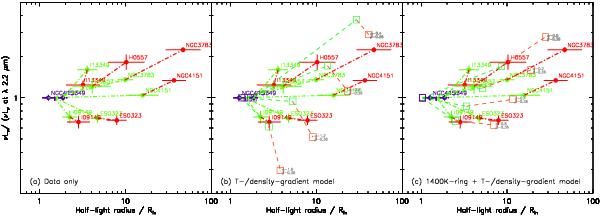
a) SED in νLν for each object normalized at λ = 2.2 μm, plotted against normalized half-light radius R1/2/Rin, for 2.2, 8.5, and 13 μm (purple, green, and red, respectively). b) The same data but with the grid in dashed lines for temperature/density gradient models with radial surface density indices of α = −0.4, −0.8, −1.2, −1.6 for the case of T ∝ r-0.36, plotted for the three wavelengths 2.2, 8.5, and 13 μm (purple, green, and red squares). This simple power-law model does not explain the observed SED and size at the same time. c) The same data but with the grid in dashed lines for the power-law (density ∝ r−0,−0.2,−0.4,−0.6, T ∝ r-0.36) + 1400 K thin-ring at Rin, which roughly explain the observed SED and size. The two reddened sources IRAS13349 and H0557-385 could be interpreted in terms of the same model with a slightly larger filling factor for the power-law component.
Current usage metrics show cumulative count of Article Views (full-text article views including HTML views, PDF and ePub downloads, according to the available data) and Abstracts Views on Vision4Press platform.
Data correspond to usage on the plateform after 2015. The current usage metrics is available 48-96 hours after online publication and is updated daily on week days.
Initial download of the metrics may take a while.