Fig. 10
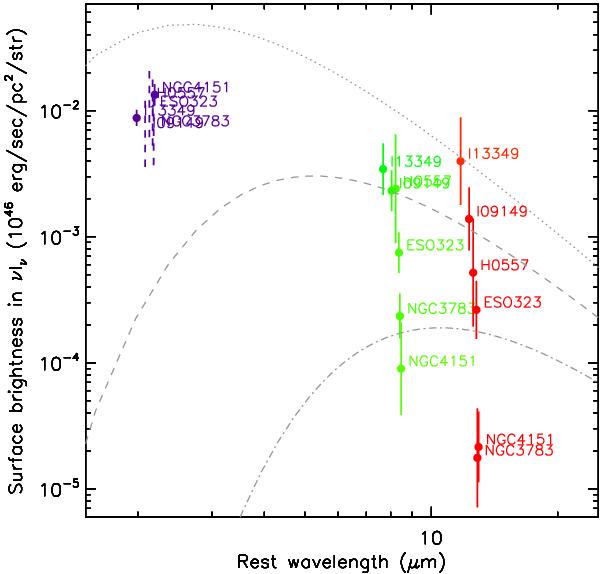
Average surface brightnesses
νIν in the rest
frame, defined as  , are plotted against rest
wavelengths. Overplotted are the Planck functions with temperatures 1400, 700,
and 350 K (dotted, dashed, and dash-dot, respectively). For NGC 4151 and IRAS13349,
which have near-IR Keck interferometry data, the average surface brightness at
2.2 μm is calculated in the same way but using thin-ring radii.
For the objects without near-IR interferometry, it is calculated assuming
R1/2 = (1.5 ± 0.5) Rin
and indicated by dashed lines. See further details in Sect. 4.1.
, are plotted against rest
wavelengths. Overplotted are the Planck functions with temperatures 1400, 700,
and 350 K (dotted, dashed, and dash-dot, respectively). For NGC 4151 and IRAS13349,
which have near-IR Keck interferometry data, the average surface brightness at
2.2 μm is calculated in the same way but using thin-ring radii.
For the objects without near-IR interferometry, it is calculated assuming
R1/2 = (1.5 ± 0.5) Rin
and indicated by dashed lines. See further details in Sect. 4.1.
Current usage metrics show cumulative count of Article Views (full-text article views including HTML views, PDF and ePub downloads, according to the available data) and Abstracts Views on Vision4Press platform.
Data correspond to usage on the plateform after 2015. The current usage metrics is available 48-96 hours after online publication and is updated daily on week days.
Initial download of the metrics may take a while.