Free Access
Fig. 4
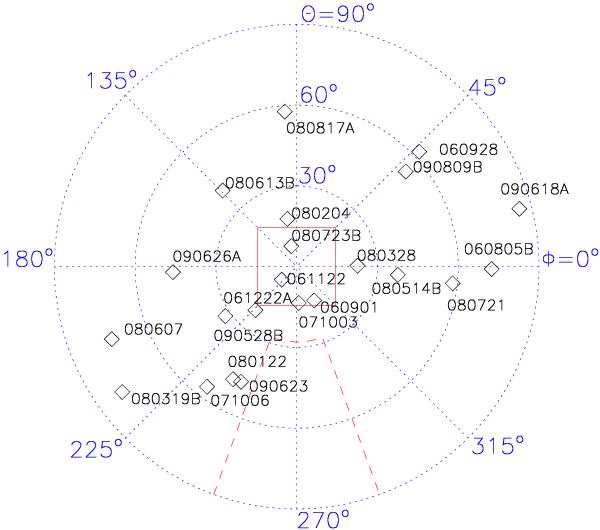
Instrumental coordinates of 22 GRBs in the PICsIT sample. The (red) square gives the approximate PICsIT FoV and dashed line borders the area where PICsIT is partially shielded by the spectrometer SPI.
Current usage metrics show cumulative count of Article Views (full-text article views including HTML views, PDF and ePub downloads, according to the available data) and Abstracts Views on Vision4Press platform.
Data correspond to usage on the plateform after 2015. The current usage metrics is available 48-96 hours after online publication and is updated daily on week days.
Initial download of the metrics may take a while.