Free Access
Fig. 9
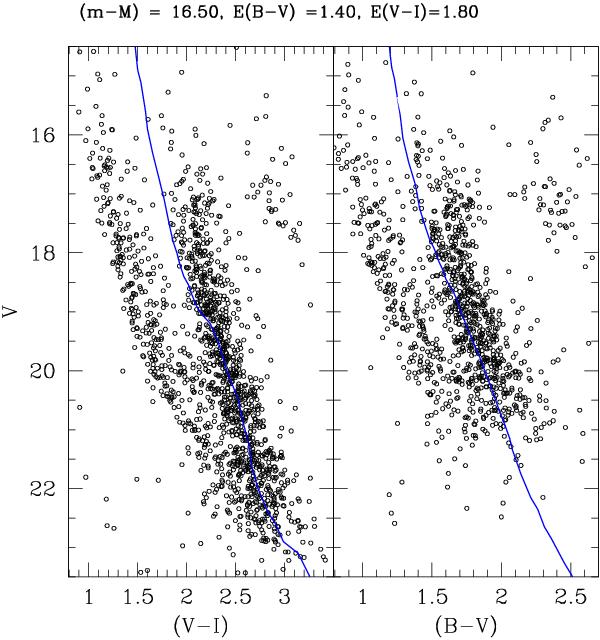
Color − magnitude diagrams for Pismis 19 stars within 5.0 arcmin of the cluster center. In the left panel the V vs. (V − I) CMD is shown, while in the right panel we show the V vs. B − V CMD. The blue lines are empirical ZAMS adjusted to fit the star distribution using the parameters indicated in the top of the figure.
Current usage metrics show cumulative count of Article Views (full-text article views including HTML views, PDF and ePub downloads, according to the available data) and Abstracts Views on Vision4Press platform.
Data correspond to usage on the plateform after 2015. The current usage metrics is available 48-96 hours after online publication and is updated daily on week days.
Initial download of the metrics may take a while.