Fig. 8
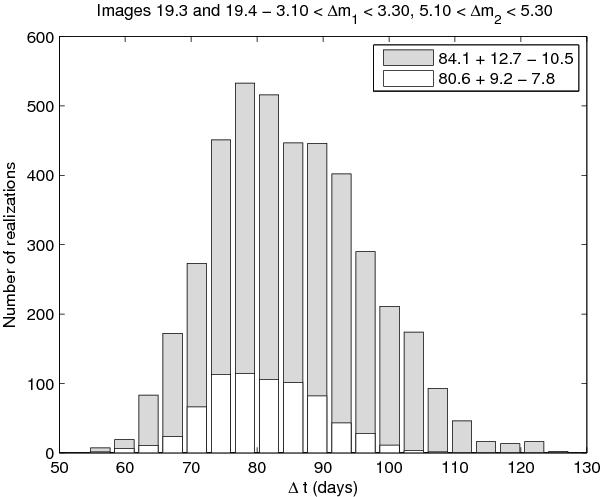
Constraints on the time delay between images 19.3 and 19.4 at z = 2.60 behind A1689 using the magnification of both images. In the shaded histogram we show the time delay distribution from the complete Monte Carlo Markov chain. The unfilled histogram indicates the distribution after the cuts corresponding to magnification constraints. Errors are given as 1σ confidence intervals.
Current usage metrics show cumulative count of Article Views (full-text article views including HTML views, PDF and ePub downloads, according to the available data) and Abstracts Views on Vision4Press platform.
Data correspond to usage on the plateform after 2015. The current usage metrics is available 48-96 hours after online publication and is updated daily on week days.
Initial download of the metrics may take a while.