Fig. 1
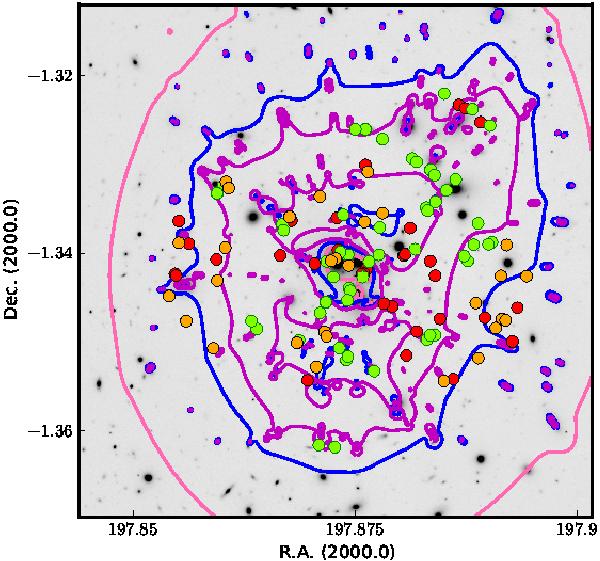
Magnification map of A1689 overlaid on top of an HST ACS image of the cluster. The Δm = 1,2,3 mag (pink, blue, magenta) contours are shown for a source at z = 2. The green (orange) circles indicate the positions of strongly lensed galaxies with spectroscopic redshifts and time delays shorter than (above) five years. Red points indicate strongly lensed sources with photometric redshifts.
Current usage metrics show cumulative count of Article Views (full-text article views including HTML views, PDF and ePub downloads, according to the available data) and Abstracts Views on Vision4Press platform.
Data correspond to usage on the plateform after 2015. The current usage metrics is available 48-96 hours after online publication and is updated daily on week days.
Initial download of the metrics may take a while.