Fig. 32
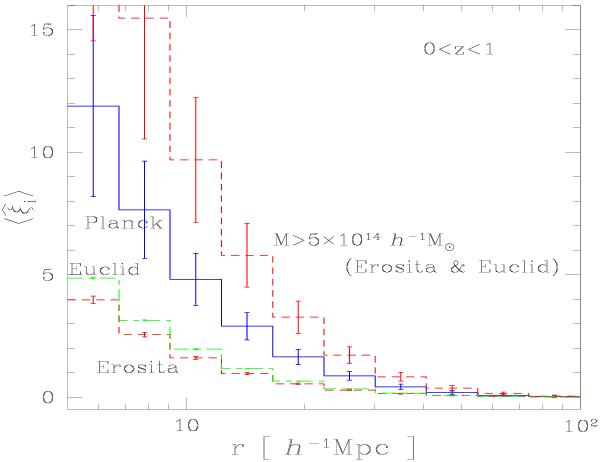
The mean correlation,  , integrated over 0 < z < 1, as in Fig. 29. From top to bottom, we show a) halos above 5 × 10¹⁴ h-1 M⊙ in either Erosita or Euclid, b) halos detected by Planck with the selection function of the middle panel in Fig. J.1, c) halos above 5 × 10¹³ h-1 M⊙ in Euclid, and d) halos detected by Erosita with the selection function of the right panel in Fig. J.1.
Current usage metrics show cumulative count of Article Views (full-text article views including HTML views, PDF and ePub downloads, according to the available data) and Abstracts Views on Vision4Press platform.
Data correspond to usage on the plateform after 2015. The current usage metrics is available 48-96 hours after online publication and is updated daily on week days.
Initial download of the metrics may take a while.