Free Access
Fig. 30
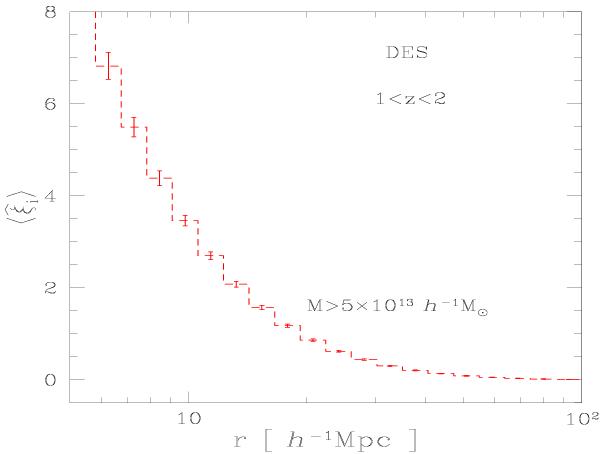
The mean correlation,  , for the clusters detected by DES over the redshift interval 1 < z < 2. Here we consider 20 distance bins within 5 < r < 100 h-1 Mpc, equally spaced in log (r) (i.e. twice as many as in Fig. 29).
Current usage metrics show cumulative count of Article Views (full-text article views including HTML views, PDF and ePub downloads, according to the available data) and Abstracts Views on Vision4Press platform.
Data correspond to usage on the plateform after 2015. The current usage metrics is available 48-96 hours after online publication and is updated daily on week days.
Initial download of the metrics may take a while.