Fig. 27
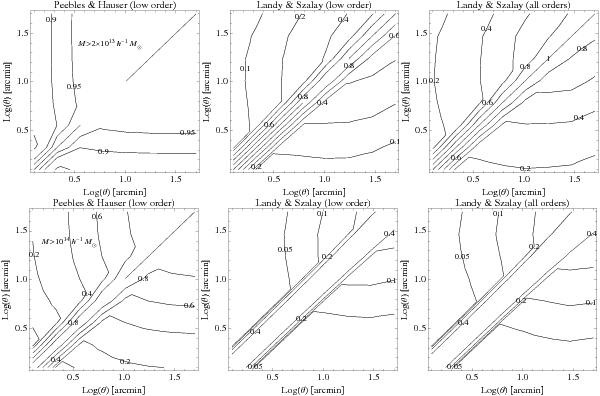
Contour plots for the correlation matrix ℛi,j, defined as in Eq. (46) but for the full covariance matrix Cij of the halo angular correlation. There are eight angular bins, over 1.25 < r < 50 arcmin, equally spaced in log (θ), as in previous figures. We consider halos in the redshift range 0 < z < 0.8, with an angular window of 400 deg2, above the mass thresholds M > 2 × 10¹³ h-1 M⊙ in the upper row, and M > 1014 h-1 M⊙ in the lower row. Left panels: low-order contributions (93) for the Peebles & Hauser estimator. Middle panels: low-order contributions (94) for the Landy & Szalay estimator. Right panels: full correlation matrix, including the high-order contributions of Eqs. (96)–(98), for the Landy & Szalay estimator.
Current usage metrics show cumulative count of Article Views (full-text article views including HTML views, PDF and ePub downloads, according to the available data) and Abstracts Views on Vision4Press platform.
Data correspond to usage on the plateform after 2015. The current usage metrics is available 48-96 hours after online publication and is updated daily on week days.
Initial download of the metrics may take a while.