Free Access
Fig. 7
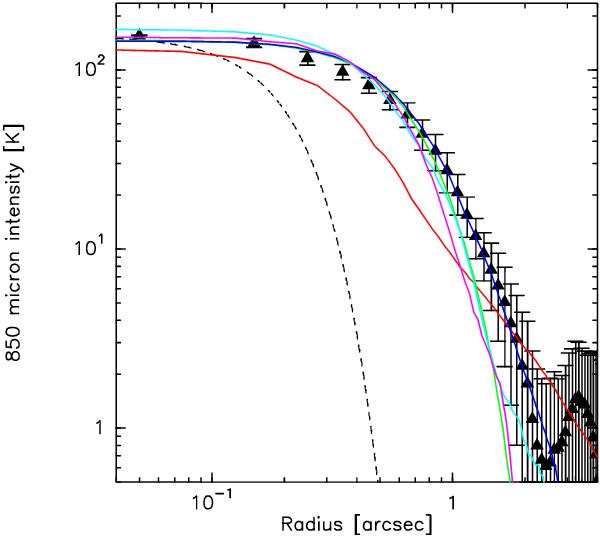
Models A (red), B (green), C (blue), D (cyan), and E (magenta) compared to the SMA continuum profile, which is displayed as data points with a 0.1′′ radial interval. The errorbars denote the rms deviation from a circular shape, and the dashed curve represents the beam.
Current usage metrics show cumulative count of Article Views (full-text article views including HTML views, PDF and ePub downloads, according to the available data) and Abstracts Views on Vision4Press platform.
Data correspond to usage on the plateform after 2015. The current usage metrics is available 48-96 hours after online publication and is updated daily on week days.
Initial download of the metrics may take a while.