Free Access
Fig. 4
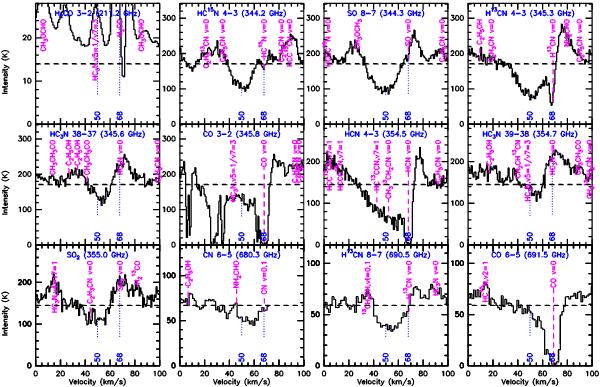
Lines with absorption features toward the continuum peak. The systemic velocity of 68 km s-1 and a blue-shifted velocity of 50 km s-1 are marked. There are absorption components centered at both velocities, indicating expansion. The dashed horizontal line denotes the continuum level.
Current usage metrics show cumulative count of Article Views (full-text article views including HTML views, PDF and ePub downloads, according to the available data) and Abstracts Views on Vision4Press platform.
Data correspond to usage on the plateform after 2015. The current usage metrics is available 48-96 hours after online publication and is updated daily on week days.
Initial download of the metrics may take a while.