Fig. 3
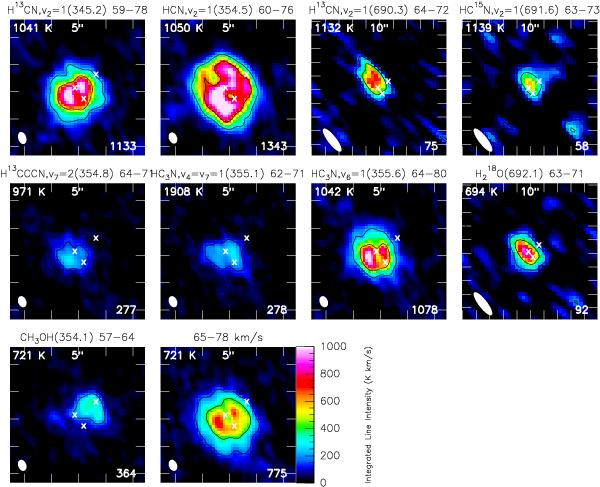
Selected high-excitation line maps. The molecule, the frequency of the transition (in GHz), and the velocity range (in km s-1) are given above each panel. The color scale ranges from 0 to 1000 K km s-1 at 345/355 GHz, where the map size is 5′′, and from 0 to 100 K km s-1 at 690 GHz, where the map size is 10′′. Beams are shown in the lower left, and the number in the lower right of each panel is the maximum flux in K km s-1 (contours are ± 20 and 50% of that value). The energy of the lower level is given in the upper left.
Current usage metrics show cumulative count of Article Views (full-text article views including HTML views, PDF and ePub downloads, according to the available data) and Abstracts Views on Vision4Press platform.
Data correspond to usage on the plateform after 2015. The current usage metrics is available 48-96 hours after online publication and is updated daily on week days.
Initial download of the metrics may take a while.