Fig. 2
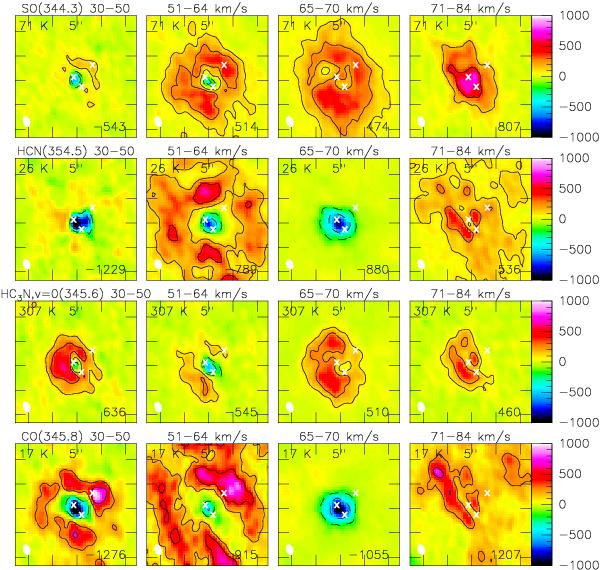
Line maps (selected to trace expansion motions) integrated over the velocity range indicated in each panel (which can be considered, from left to right, as the high-velocity part of the outflow, low-velocity part, systemic velocity, and low-velocity part of the outflow at the far side). The first velocity range of HC3N is blended by other lines. In the second velocity range of CO the emission is extended this much to cause imaging artifacts. The map size is 5′′ (tick spaces are 1′′, centered on RA 18:08:38.236, Dec –19:51:50.25). Beams are shown in the lower left, and the number in the lower right of each panel is the maximum flux in K km s-1 (contours are ± 20 and 50% of that value). The color scale is from –1000 to 1000 K km s-1. The energy of the lower level is given in the upper left.
Current usage metrics show cumulative count of Article Views (full-text article views including HTML views, PDF and ePub downloads, according to the available data) and Abstracts Views on Vision4Press platform.
Data correspond to usage on the plateform after 2015. The current usage metrics is available 48-96 hours after online publication and is updated daily on week days.
Initial download of the metrics may take a while.