Fig. 14
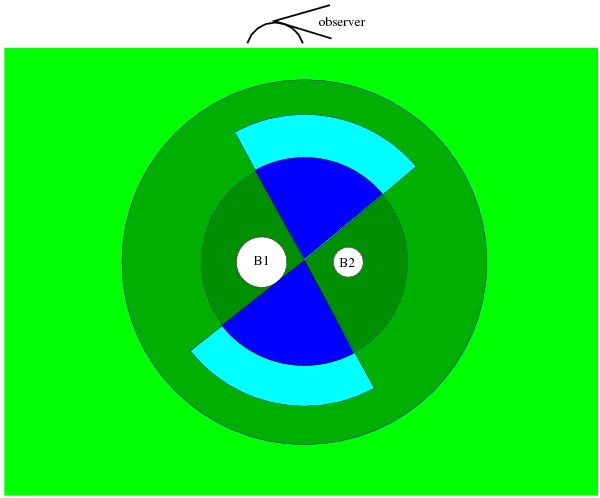
Qualitative scenario for the outflow in G10.47+0.03. The observer is above the plot. Infalling molecular gas is shown in green, expanding molecular gas in blue, and ionized gas in white. The circles denote half-maximum and Plummer radius in Model C (the gas must be clumpy, though) and the boundaries of the Hii regions, which have density gradients (Cesaroni et al. 2010). If the Hii regions are not spherical, the outflow could also develop from the ionizing stars.
Current usage metrics show cumulative count of Article Views (full-text article views including HTML views, PDF and ePub downloads, according to the available data) and Abstracts Views on Vision4Press platform.
Data correspond to usage on the plateform after 2015. The current usage metrics is available 48-96 hours after online publication and is updated daily on week days.
Initial download of the metrics may take a while.