Free Access
Fig. 12
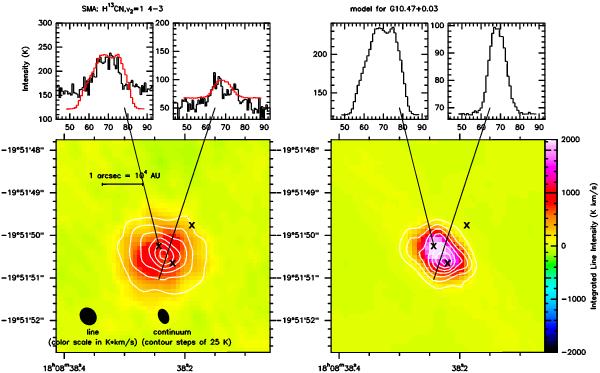
Model E (right) compared to the J = 4 − 3 line of vibrationally excited H13CN at 345.2 GHz (SMA), shown as integrated line map and spectra at two locations (left, model spectra are overlaid in red). The white contours denote the 345 GHz continuum in steps of 25 K.
Current usage metrics show cumulative count of Article Views (full-text article views including HTML views, PDF and ePub downloads, according to the available data) and Abstracts Views on Vision4Press platform.
Data correspond to usage on the plateform after 2015. The current usage metrics is available 48-96 hours after online publication and is updated daily on week days.
Initial download of the metrics may take a while.