Fig. 1
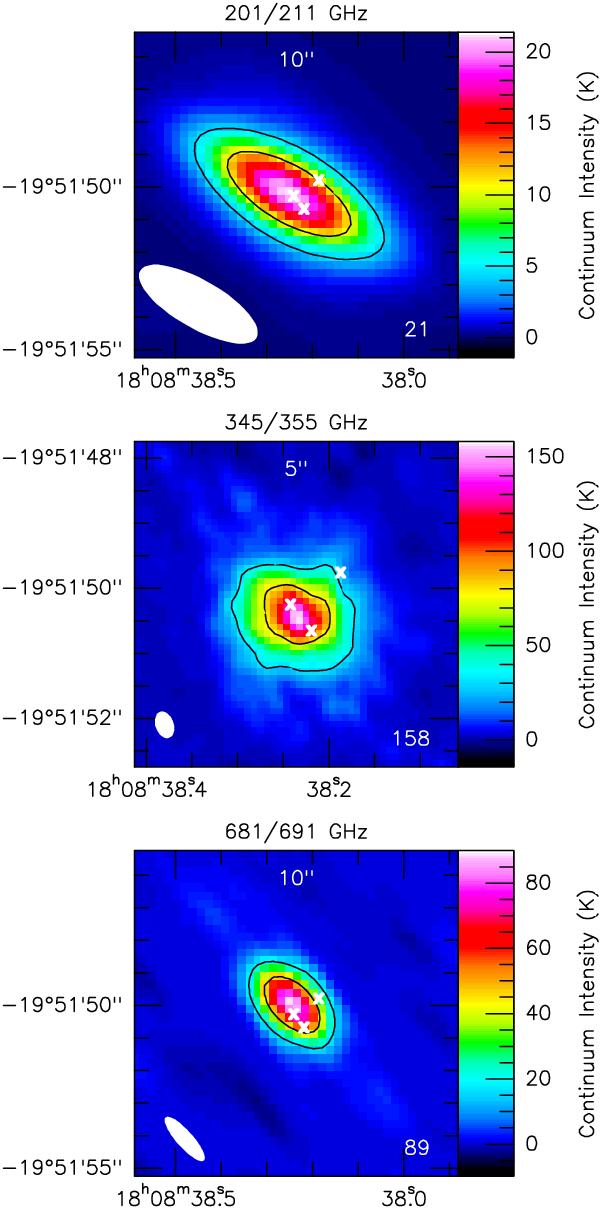
Continuum maps of G10.47+0.03 observed with the SMA at 201/211 GHz (top panel), 345/355 GHz (central), and 681/691 GHz (bottom). The map size is either 5 or 10′′. Contours mark 20 and 50% of the peak flux, which is given in the lower right (in K). The beam is depicted in the lower left. The white crosses denote the Hii regions B1, B2, and A (Cesaroni et al. 2010, from left to right).
Current usage metrics show cumulative count of Article Views (full-text article views including HTML views, PDF and ePub downloads, according to the available data) and Abstracts Views on Vision4Press platform.
Data correspond to usage on the plateform after 2015. The current usage metrics is available 48-96 hours after online publication and is updated daily on week days.
Initial download of the metrics may take a while.