Fig. 6
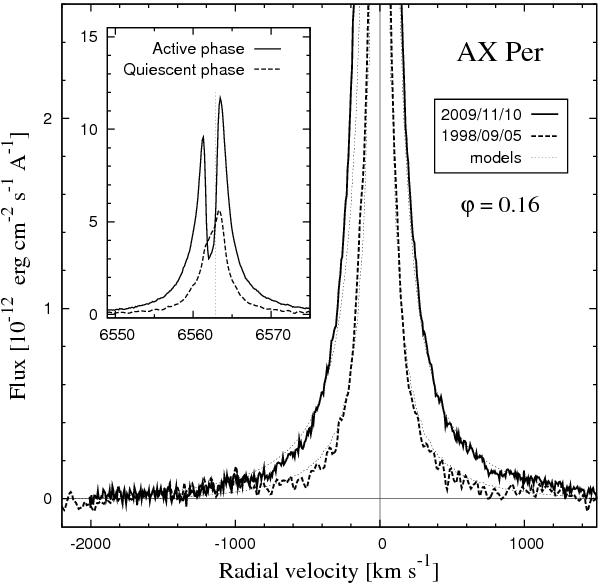
Example of the broad Hα wings from the 2007–10 active phase (solid line), compared with those observed during quiescent phase (dashed line). Both spectra were taken at the same orbital phase, ϕ = 0.16. Local continua were subtracted from the spectra. The spectra were dereddened. The models (dotted lines) indicate a significant enhancement of the mass-loss rate during activity with respect to quiescence (Table 7, Sect. 3.2.2).
Current usage metrics show cumulative count of Article Views (full-text article views including HTML views, PDF and ePub downloads, according to the available data) and Abstracts Views on Vision4Press platform.
Data correspond to usage on the plateform after 2015. The current usage metrics is available 48-96 hours after online publication and is updated daily on week days.
Initial download of the metrics may take a while.