Fig. 5
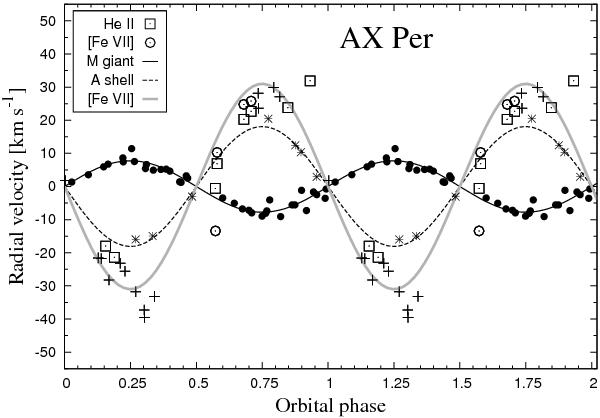
Radial velocities of main emission peaks measured for highly ionized elements (open symbols, Table 6) as a function of the photometric phase (1). Compared are radial velocity curves for the M-type (Fekel et al. 2000, solid line, filled circles) and A-type absorption lines (Mikolajewska & Kenyon 1992,dashed line, asterisks), and emission peaks of [Fe vii] λ6087 line (Iijima 1988,grey line, crosses). Systemic velocity of –117.44 km s-1 was subtracted.
Current usage metrics show cumulative count of Article Views (full-text article views including HTML views, PDF and ePub downloads, according to the available data) and Abstracts Views on Vision4Press platform.
Data correspond to usage on the plateform after 2015. The current usage metrics is available 48-96 hours after online publication and is updated daily on week days.
Initial download of the metrics may take a while.