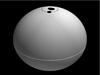
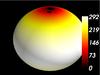
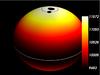
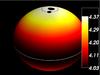
Fig. 7
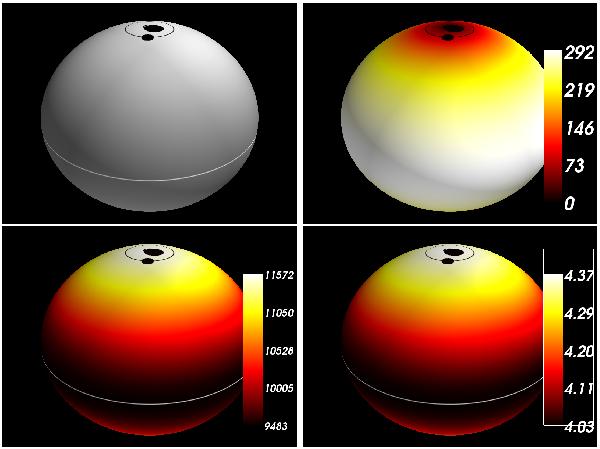
Stellar parameters across the rotationally distorted surface of the star, and location of the spots. The paths of the spots are shown in black lines. The equator of the star is shown as a white line. Top left: emitted flux (linear scale). Top right: rotation velocity (km s-1). Bottom left: effective temperature (K). Bottom right: logarithmic surface gravity (cgs) (coloured version only online).
Current usage metrics show cumulative count of Article Views (full-text article views including HTML views, PDF and ePub downloads, according to the available data) and Abstracts Views on Vision4Press platform.
Data correspond to usage on the plateform after 2015. The current usage metrics is available 48-96 hours after online publication and is updated daily on week days.
Initial download of the metrics may take a while.