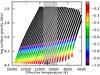
Fig. 4
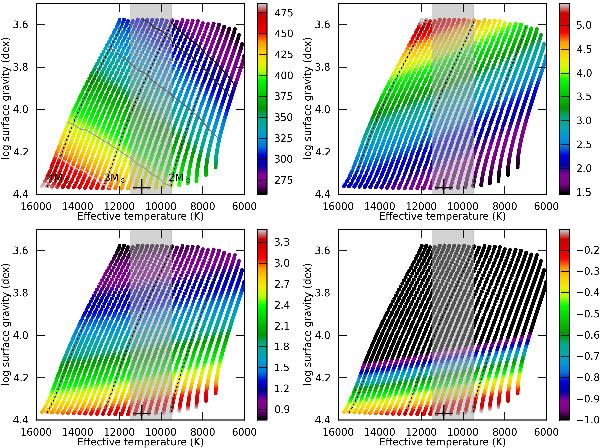
Critical rotation velocities and frequencies, and their relation to stellar parameters for models between 1.5 and 4.1 M⊙. The grey band shows the range of Teff matching the observed spectra, the + sign shows the location of the best matching model in km s-1 (see text). Top left panel: critical velocities on the main sequence for CLÉS models with αov = 0.2. The black line shows the line of models matching the observed veqsini with i = 90°. The grey lines show the models reaching their critical rotation frequency for different inclination angles for the observed veqsini (i = 40°,45°,60°,75° and 90°). The colours represent the values of different of the following quantities. Top right: Req for zero rotation (R⊙). Bottom left: critical rotation frequency (d-1). Bottom right: necessary differential rotation rate α for a model to reach f1 at the pole with Ωeq = Ωcrit.
Current usage metrics show cumulative count of Article Views (full-text article views including HTML views, PDF and ePub downloads, according to the available data) and Abstracts Views on Vision4Press platform.
Data correspond to usage on the plateform after 2015. The current usage metrics is available 48-96 hours after online publication and is updated daily on week days.
Initial download of the metrics may take a while.