Fig. 2
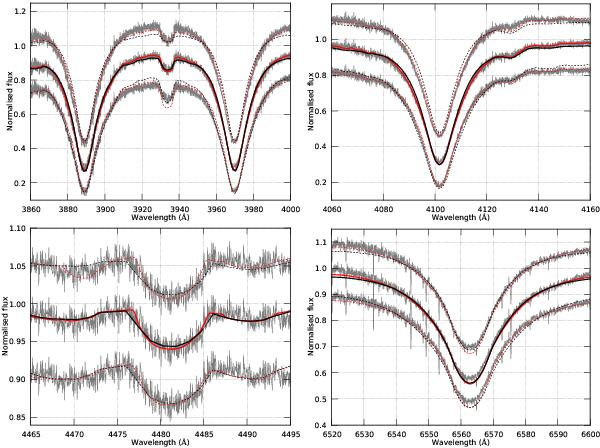
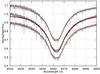
Comparison between model template spectra (black), synthetic spectra (red) additionally deformed according to model parameters resulting from the spot model fit (see text), and the observed profiles (grey) (from top to bottom and left to right: Ca ii 3933 Å with Hζ and Hϵ, Hδ, Mg ii 4481 Å and Hα). In each panel, the top black spectrum shows the comparison to a template with parameters Teff = 11 500 K and log g = 4.0, the middle to the template Teff = 10 500 K and log g = 4.0 and the bottom to Teff = 9500 K and log g = 4.0. The top and bottom red dashed lines show models (with log g = 4.0) compatible with the photometry with Teff = 11 580 K and Teff = 10 357 K, respectively.
Current usage metrics show cumulative count of Article Views (full-text article views including HTML views, PDF and ePub downloads, according to the available data) and Abstracts Views on Vision4Press platform.
Data correspond to usage on the plateform after 2015. The current usage metrics is available 48-96 hours after online publication and is updated daily on week days.
Initial download of the metrics may take a while.