Fig. 1
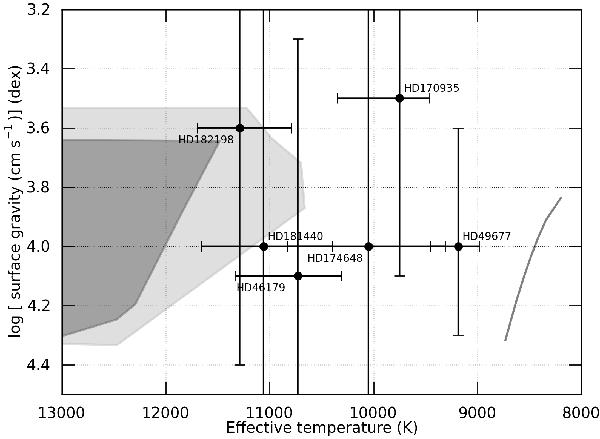
Location of the sample in the Teff−log g diagram as determined with multicolour photometry. The right grey line represents the blue edge of the δ Sct instability strip. The light and dark grey regions represent SPB instability strips with Z = 0.01 (dark grey) and Z = 0.02 (light grey) and were taken from Miglio et al. (2007b).
Current usage metrics show cumulative count of Article Views (full-text article views including HTML views, PDF and ePub downloads, according to the available data) and Abstracts Views on Vision4Press platform.
Data correspond to usage on the plateform after 2015. The current usage metrics is available 48-96 hours after online publication and is updated daily on week days.
Initial download of the metrics may take a while.