Fig. 10
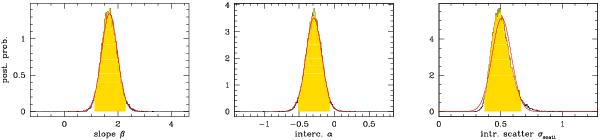
Posterior probability distribution for the parameters of the X-ray luminosity-richness scaling. The black jagged histogram shows the posterior as computed by MCMC, marginalized over the other parameters. The red curve is a Gaussian approximation of it. The shaded (yellow) range shows the 95% highest posterior credible interval. The jagged nature of the histogram is caused by the finite sampling of the posterior.
Current usage metrics show cumulative count of Article Views (full-text article views including HTML views, PDF and ePub downloads, according to the available data) and Abstracts Views on Vision4Press platform.
Data correspond to usage on the plateform after 2015. The current usage metrics is available 48-96 hours after online publication and is updated daily on week days.
Initial download of the metrics may take a while.