Fig. 35
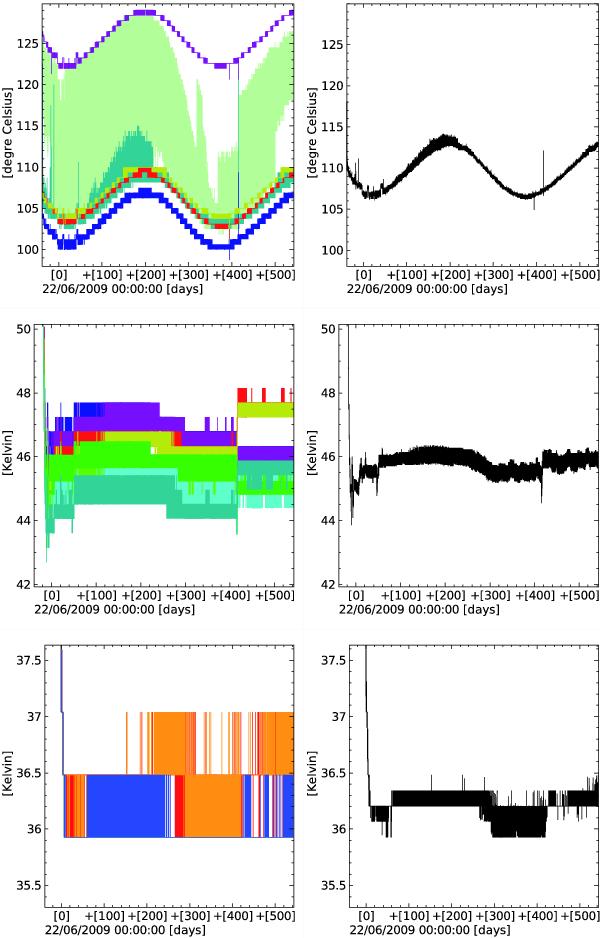
Seasonal variation in the temperature of the solar panel (top), V-groove 3 (middle), and the primary mirror (bottom). Individual readings are shown for multiple temperature sensors on each part of the structure (left, all three panels). Quantization effects are clearly visible for V-groove 3 and the primary mirror. These are reduced but not eliminated by averaging the relevant sensors (black line in all three panels).
Current usage metrics show cumulative count of Article Views (full-text article views including HTML views, PDF and ePub downloads, according to the available data) and Abstracts Views on Vision4Press platform.
Data correspond to usage on the plateform after 2015. The current usage metrics is available 48-96 hours after online publication and is updated daily on week days.
Initial download of the metrics may take a while.