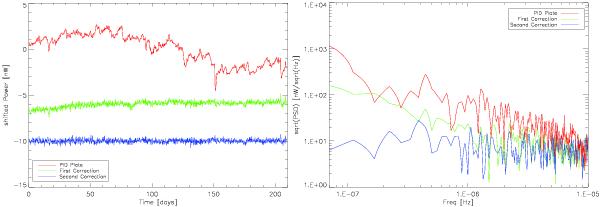
Fig. 30

Left – variation with time of the power dissipated by the PID regulating the temperature of the bolometer plate (red curve; same as the green curve in Fig. 29). Subtracting the part that is correlated with the cosmic ray heat input as measured by the SREM gives the green curve. Subtracting the part that is correlated with the PID on the dilution stage gives the blue curve. The constancy of the blue curve shows that cosmic rays and variations in the dilution stage account for all of the very low frequency variation in heat input to the bolometer plate. Right – frequency domain versions of the same curves.
Current usage metrics show cumulative count of Article Views (full-text article views including HTML views, PDF and ePub downloads, according to the available data) and Abstracts Views on Vision4Press platform.
Data correspond to usage on the plateform after 2015. The current usage metrics is available 48-96 hours after online publication and is updated daily on week days.
Initial download of the metrics may take a while.


