Fig. 28
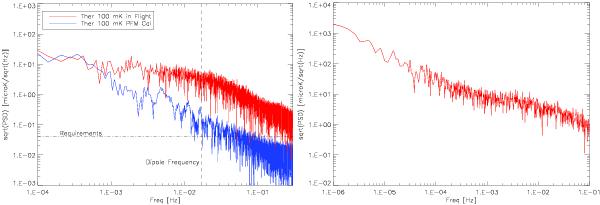
Left – frequency spectrum of the temperature of the bolometer plate, measured in flight (red) and on the ground (blue). Right – spectrum of the flight measurements over a wider frequency range. The shoulder on the low frequency side is due to the temperature fluctuations described in Fig. 30. The bump in the 10-2 to 10-3 Hz range seen, also seen in the left panel but only in the flight curve, is probably associated with the effect of cosmic rays in the bolometer structures.
Current usage metrics show cumulative count of Article Views (full-text article views including HTML views, PDF and ePub downloads, according to the available data) and Abstracts Views on Vision4Press platform.
Data correspond to usage on the plateform after 2015. The current usage metrics is available 48-96 hours after online publication and is updated daily on week days.
Initial download of the metrics may take a while.