Fig. 26
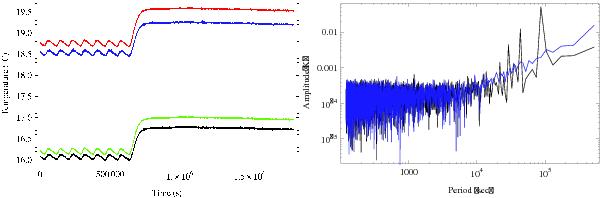
Left – LFI backend temperatures (black – left BEM1 sensor; blue – left BEM2 sensor; red – right BEM1 sensor; green – right BEM2 sensor) around day 259 of flight operations, when the transition to an always-on condition for the transponder was implemented. Right – comparison of the Fourier transform amplitude of the Left BEM1 sensor before (black) and after (blue) transition to stable, showing the daily time scale peaks disappearing.
Current usage metrics show cumulative count of Article Views (full-text article views including HTML views, PDF and ePub downloads, according to the available data) and Abstracts Views on Vision4Press platform.
Data correspond to usage on the plateform after 2015. The current usage metrics is available 48-96 hours after online publication and is updated daily on week days.
Initial download of the metrics may take a while.