Free Access
Fig.7
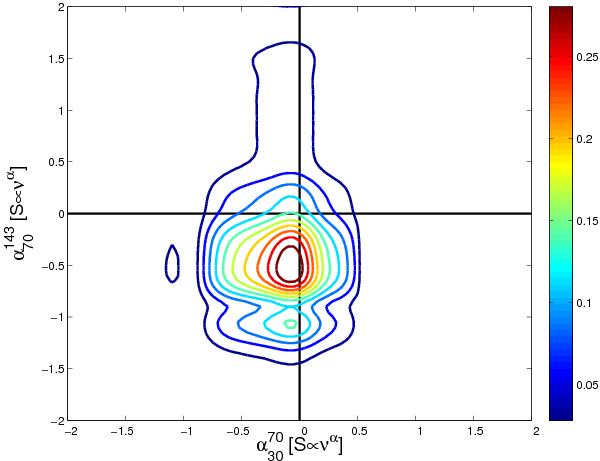
Contour levels of the distribution of  vs.
vs.  obtained by Survival Analysis, i.e., taking into account the upper limits to flux densities at each frequency. The colour scale can be interpreted as the probability of having any particular pair of values of the two spectral indices. The maximum probability corresponds to
  and
and  .
.
Current usage metrics show cumulative count of Article Views (full-text article views including HTML views, PDF and ePub downloads, according to the available data) and Abstracts Views on Vision4Press platform.
Data correspond to usage on the plateform after 2015. The current usage metrics is available 48-96 hours after online publication and is updated daily on week days.
Initial download of the metrics may take a while.